Examples · Plots
waterfall
The single-decision plot: baseline, integer impacts, residual, final score and band.
Code#
waterfall.py
import matplotlib.pyplot as plt from _setup import artifact, row from compileml.runtime import decidefrom compileml.viz import waterfall decision = decide(artifact, row, include_contributions=True)fig, ax = waterfall(decision, max_features=8)fig.savefig("../../public/examples/waterfall.png", dpi=144, bbox_inches="tight")plt.close(fig) contributions = decision["contributions"]total = decision["latent_int"] print("band ", decision["band"])print("latent_int ", total)print("features ", len(contributions))print()print("The plot reads the same integers the runtime returned. It cannot")print("disagree with the deployed decision, because it is not recomputing it.")Output#
Captured from an actual run against compileml 0.9.0 and the UCI credit panel. If this script stops working, the build fails.
captured in CIwaterfall.py
band G09latent_int 341features 19 The plot reads the same integers the runtime returned. It cannotdisagree with the deployed decision, because it is not recomputing it.Figure#
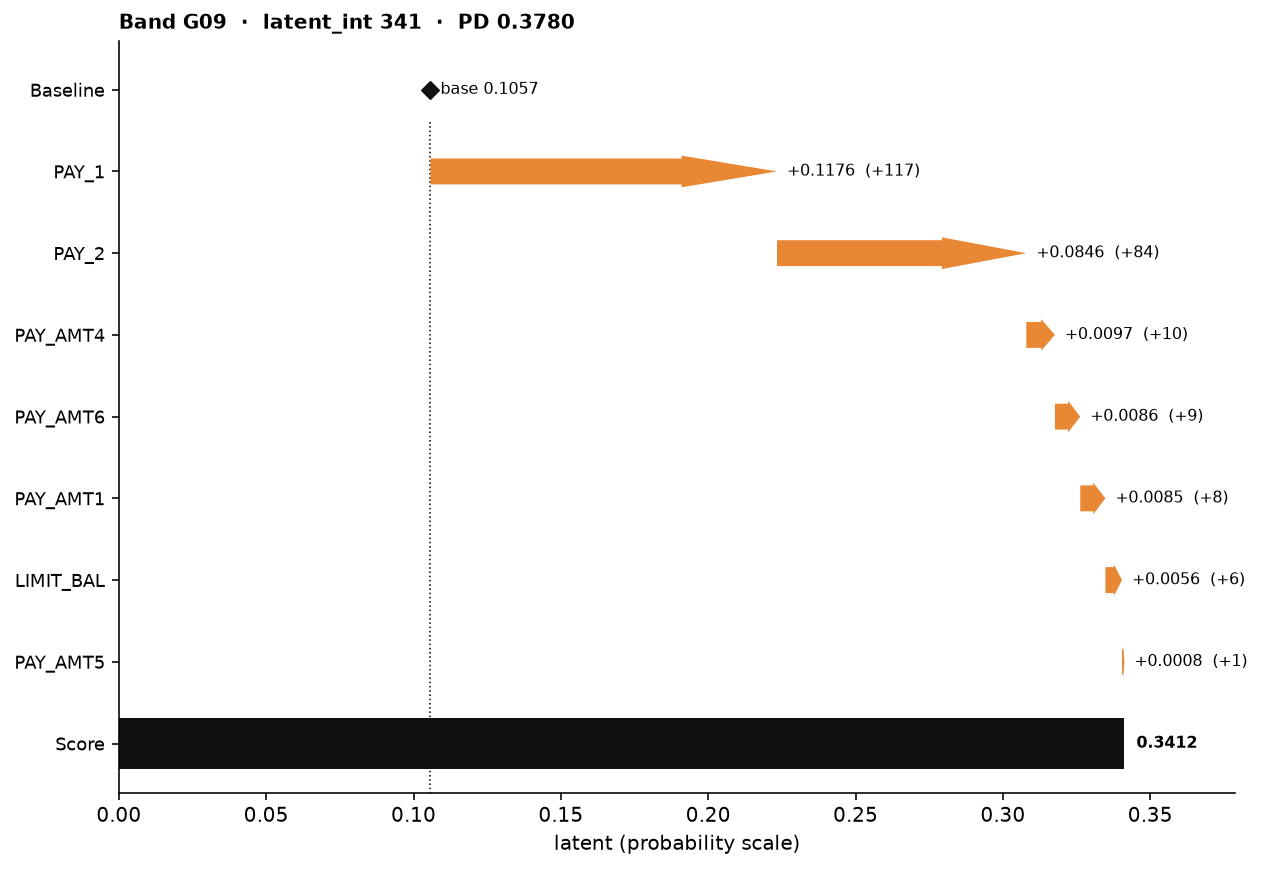
Rendered by the run above, from the decision payload rather than a recomputation.
Notes#
- The bars are the payload's integers, so the figure cannot disagree with the decision.